Introduction to CTD Wellbore Hydraulic Modelling - Part Two
This chart shows us, for a given depth point in a particular well, for a particular pumping rate, through given CT and BHA, the pressures at every point in the system. Points of particular interest are:
Bottom hole circulating pressure (BHCP)
If we were not circulating, this would be simply the hydrostatic head of the fluid in the wellbore. To that hydrostatic component, we add the frictional pressure due to the velocity of the fluid moving up the wellbore and any choke pressure applied at surface. If we are drilling conventionally, we will seek to maintain this BHCP a little above the formation pressure to maintain well control. If this pressure is allowed to rise too far above the formation pressure, we may end up unintentionally fracturing the formation and losing circulation.
As we are speaking in the context of coiled tubing drilling, it is more likely that we will want to maintain this pressure a little below formation pressure, allow the formation to produce while drilling and keep the matrix uncontaminated by drilling fines.
Guide arch pressure
When coiled tubing comes off the reel, over the guide arch and down the hole, it straightens, bends and straightens again. This represents extreme plastic strain of the material and leads to failure of the material after a small number of cycles. It is well understood that the exact number of cycles before fatigue failure is strongly dependent on the pressure inside the CT when it is plastically bent. The dependency is non linear, such that an increase in pressure of 1000 psi from 2000 to 3000 psi can more than halve the fatigue life of the coil. It is therefore of vital importance in estimating the cost of a proposed job, to know what the pressure at the guide arch is likely to be, in order that the percentage use of the coil’s fatigue life may be accurately costed.
Pump Pressure
Ultimately it is the rig pumps that maintain the circulation that causes the interesting pressure profile that we have seen above. Knowing the required pump pressure is vital in specifying the correct equipment for the job. Once a pump is specified, knowing the pressure and flow rates expected throughout the job enables a total fuel burn to be estimated, further refining the job’s economic model.
Informative and useful though this undoubtedly is, we have to recall that the chart in figure 1 is correct for only one flow rate (or one set of flow rates if we are pumping a 2 phase mix). Increase the liquid rate or reduce the N2 rate and the picture changes. How much more useful if we could combine the information in figure 1 with sensitivity to flow rates.
For the moment, let’s assume that we are going to maintain the liquid pump rate at, say, 40 USGPM. We can vary the N2 injection rate in 6 steps between zero and 1000 scfm. That gives us six flow rate specific versions of figure 1. All six are presented below as figure 2.
Author: Richard Stevens
Published: 22nd June 2017
Comments


Comment
Your Email
Enter your comment here:
Enter Your Comment
Your Email
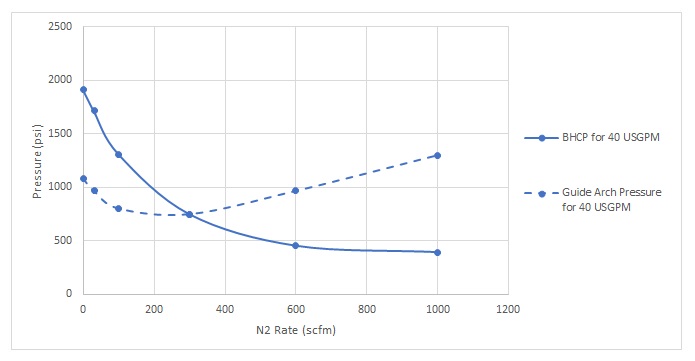
If we continue to study the results in figure 2, it is clear that there is also a trend in guide arch pressure. We can plot that trend on the same set of axes.
Figure 2 - Pressure profiles for varing N2 rate at fixed liquid rate of 40 USGPM
Figure 4 - Variation of BHCP and Guide arch pressure with N2 rate for fixed liquid rate
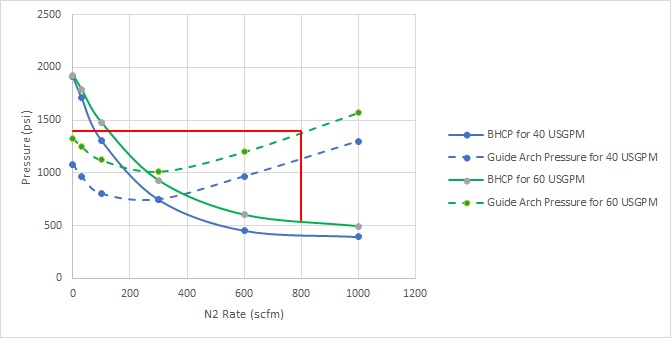
Now we can repeat the process for a different fixed liquid flow rate. Let’s say 60 USGPM this time. Here are the 6 sets of pressure curves.
Again, we can see the trends in BHCP and guide arch pressure. Just like before, we can add the trends to our XY plot.
Figure 3 - BHCP vs N2 rate for results in figure 2.

Figure 1 - Pressure Profile
If we study the results in figure 2 we see a trend in BHCP with N2 rate. Let’s plot BHCP vs N2 rate for this set of results.
Figure 5 - Pressure profiles for varing N2 rate at fixed liquid rate of 60 USGPM
Figure 6 - Combined plots of BHCP and Guide Arch Pressure for 2 liquid flow rates
I’m sure you can see where this is going. We can add curves for as many liquid flow rates as we feel are necessary to present a clear picture. What we get as a result is a single sheet that tells us at a glance what combination of pump rates we need to maintain to get us a particular BHCP. Once we have identified an operating point, all we need to do is track vertically until we hit the corresponding guide arch pressure line, then read off horizontally what our guide arch pressure will be at our chosen operating point. An example is shown in figure 6. A combination of 60 USGPM of liquid and 800 SCFM of N2 gives us a BHCP of 550 psi. Reading vertically up until we hit the green dashed guide arch pressure line corresponding to that liquid flow rate, then across, we see that the guide arch pressure at that operating point is 1400 PSI.
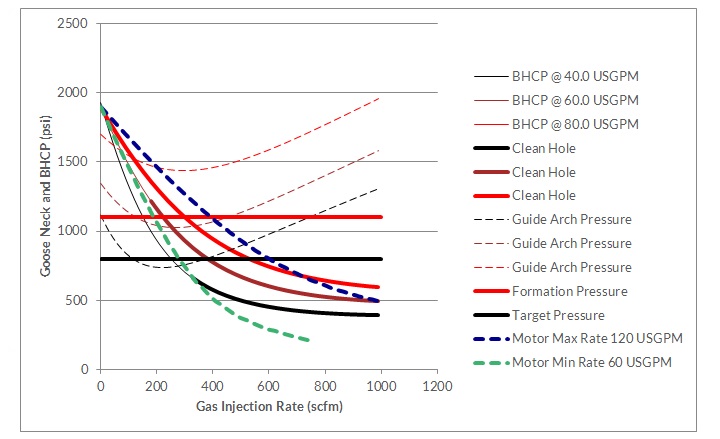
We can add a horizontal (pressure) cursor to indicate the pore pressure in the formation we are drilling, and we can add limit lines for our mud motor. We can extend the principle we applied to BHCP and Guide arch pressure above, to bring out pump pressure and display it in the same way.
Figure 7 - Combined plots of BHCP and Guide Arch Pressure for 2 liquid flow rates
You’ll agree that the chart is looking a little crowded now. However richness of information delivered in a single image makes perseverance worthwhile.
The observant reader will notice something about the BHCP lines. They vary in thickness. We use this to convey one more vital piece of information gleaned from the hydraulic model – hole cleaning. Exactly how we do this is the subject of a future blog.
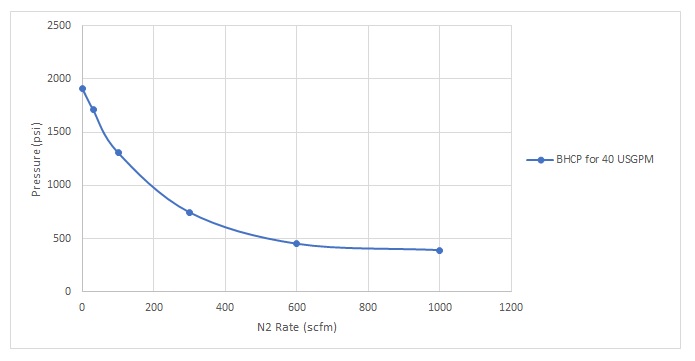
Figure 3 - BHCP vs N2 rate for results in figure 2
In my last blog post, I introduced the principles of hydraulic modelling for coiled tubing drilling. I left you with this beautiful chart, depicting the pressure distribution throughout the hydraulic circuit for a specific set of operating conditions.


+44 1392 933 100 | +1 800-868-1562