Introduction To CTD Wellbore Hydraulic
Modelling - Part One
In the last article I introduced the importance of modelling in the context of Coiled Tubing Drilling and explored how a fit-for-purpose tubing forces model can inform engineers about the weight that can be transferred to the bit and the likely length of any lateral that can be drilled, long before any trucks hit the road. In this article I shall take the same approach with hydraulics modelling. Firstly, lets recap why hydraulics matter.
Drilling produces cuttings
If we are drilling a 4-1/2 inch diameter hole with an ROP of 20 ft/hour then we are going to be producing around 320 cubic inches of cuttings per hour. To avoid burying the BHA and creating a cuttings bed around the Coiled Tubing, these cuttings need to be conveyed out of the hole. The cuttings are conveyed along the lateral and up the annulus by the same mechanisms that transport sediment along a river bed. The important thing in our case is that, unlike the river, we must not allow the cuttings to settle at any point along their journey. The mechanisms of particle transport in fluid media are well understood, and given knowledge of the wellbore and completion diameters it is straightforward to predict the annular velocities that will need to be present at all parts of the wellbore in order to keep it clean.
Pressure matters downhole
We need to keep the well under control while we are drilling it. In conventional drilling terms, keeping the well under control means maintaining a hydrostatic column in the wellbore that just over matches the pore pressure in the formation being drilled so that the hydrocarbon stays put. In Coiled Tubing terms, the definition of ‘under control’ is stretched to encompass the useful condition of having the hole slightly underbalanced so that the reservoir produces while the hole is being drilled.
But we mustn’t let the pressure in the hole get too low, or borehole caving will take place, where the differential pressure between the formation and the borehole causes chunks of the borehole wall to break off, potentially leading to pack-off of the BHA.
Equally, we must not allow the borehole pressure to exceed the fracture pressure of the formation, or we will incur losses and contaminate the formation.
Pressure matters at surface too
The pressure required at the output of the mud pump is the sum of all the pressure losses in the fluid circuit. On a CT job, these can be lumped as:
- Pressure drop across the CT
- Pressure drop across the BHA
- Pressure drop across the annulus
- Pressure drop across the choke
Clearly it will be useful to be able to predict the pump pressure, in order to be sure of turning up at the well site with correctly sized kit. It is also useful to be able to predict the Injector Guide Arch Pressure. That is, the pressure inside the CT at the position where it enters the injector. This is because coiled tubing suffers from low cycle fatigue due to plastic bending as it comes off the reel and over the guide arch. It turns out that the fatigue life of the coil is strongly dependent on guide arch pressure, so having a handle on expected guide arch pressure ahead of the job is important in determining what proportion of the CT’s life cost should be defrayed against the job.
So having identified how important it is to have a hydraulic model, how do we go about creating one? Figure 1 shows a simple horizontal wellbore being drilled with Coiled Tubing.
Fluid flows down the inside of the CT, through the BHA, which will likely have a smaller flow diameter than the CT itself, through the mud motor, through the bit nozzles and across the bit face where cuttings get entrained. Finally, the fluid, now carrying cuttings, flows along the horizontal section of the annulus, up round the build and up the vertical section to the surface.
Author: Richard Stevens
Published: 29th March 2017
Comments


Comment
Your Email
Enter your comment here:
Enter Your Comment
Your Email
At the start of the modelling process we make an assumption. We assume that we can make a fairly accurate guess at the absolute pressure at one point in the system. That point is the fluid exit at the top of the annulus. In the simplest case we can assume the (gauge) pressure at this point is zero. Now let’s consider a point 50 ft down the annulus. At this point we can confidently say that the hydrostatic component of absolute pressure is 0.43 psi/ft x 50 ft = 21.5 psi higher that it was at our starting point (assuming we are pumping water).
We can also find expressions for the frictional pressure loss over this length of annulus in terms of pump rate, fluid viscosity, tubing sizes and annular wall roughness. To learn more, start by googling ‘Darcy Weisbach’. So we can come up with a good guess at absolute pressure at a point 50 ft down the annulus. We can repeat this procedure at 50ft steps all the way down the annulus, round the bend and along the horizontal, remembering that in the build and horizontal sections, a 50 ft change in measured depth results in a smaller change in vertical depth. (It is vertical depth that causes the hydrostatic component of pressure).
By the time we reach the annulus side of the bit, we have our estimate of Bottom Hole Circulating Pressure.
Well validated expressions are also available for pressure drop across a nozzle, giving us the pressure drop at the bottom end of the mud motor.
We typically model the motor as a fixed pressure drop. Motor manufacturers publish data sheets which reveal what a sensible value of pressure drop would be for a particular motor. Figure 3, an example for a 3-1/8" mud motor from Toro Downhole Tools, suggests that 350 PSI would be a sensible figure to use for that motor.
Figure 1 - A simple horizontal wellbore being drilled with CT
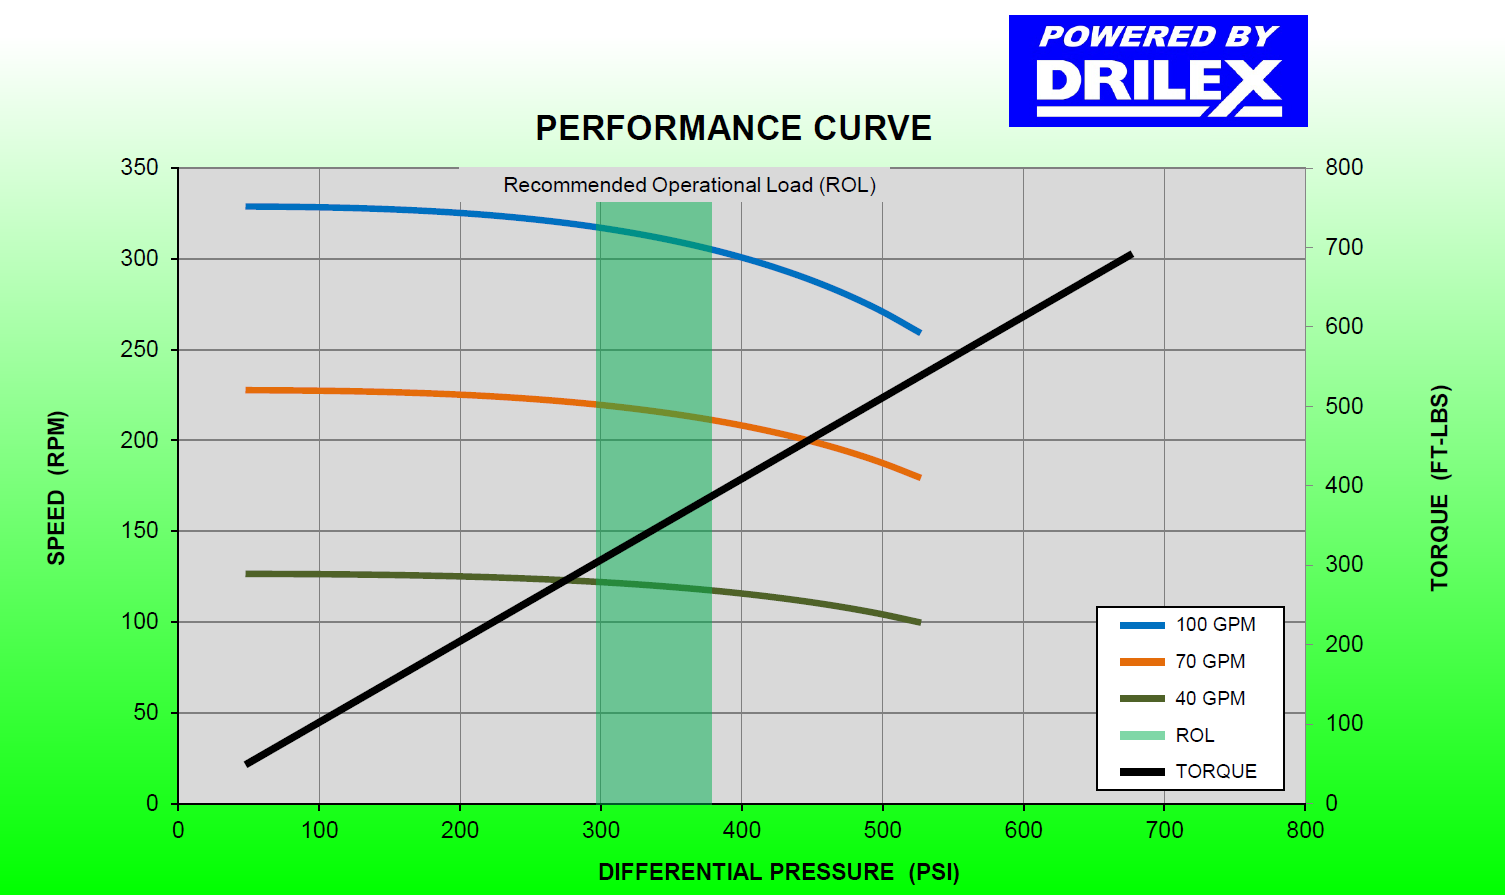
Figure 3 - Performance curves for a typical 3-1/8" mud motor, image courtesy of Toro Downhole Tools
That brings us to the bottom of (the remainder of) the BHA. Depending on the manufacturer and purpose, the flow path through the BHA may be annular or circular in section. An appropriate form of the Darcy Weisbach equation can be formulated to predict the pressure drop across the BHA. The CT between the BHA and the surface can be tackled in a similar, step by step manner to the annulus, remembering that the flow section is now circular, and that the upward calculation will continue, in steps, above 0 ft MD, to provide results for the length of CT still on the reel.
The result of these calculations, which for reasons of efficiency are best performed on a computer, is conveniently expressed in a graph like the one in Figure 4 below.
Figure 4 demonstrates how, armed with details of the hole trajectory, critical BHA dimensions, casing diameters, tubing sizes etc., an engineer sitting at a desk can crunch the numbers and generate a wealth of information about a prospective job, and make an assessment about that job, without incurring the expense of trying it for real.
Figure 4 tells us the pressure distribution through the hydraulic system. We still need to work out fluid velocities, to be certain of effective hole cleaning.
We also need to remember that, while the picture in figure 4 relates to a single flow rate of fluid at a single bit position, to be truly useful we need a representation that addresses an entire drilled section and displays sensitivity to pump rates.
We’ll tackle these items in the next article.
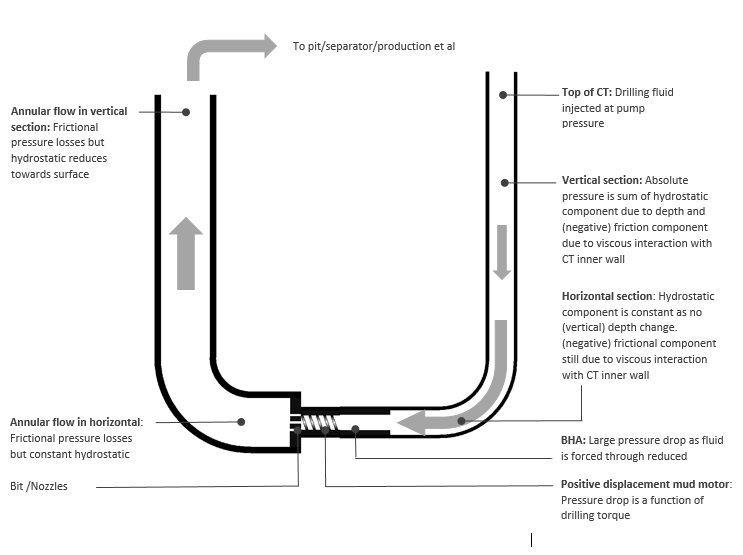
Figure 2 - 'U' tube representation of CTD wellbore hydraulics
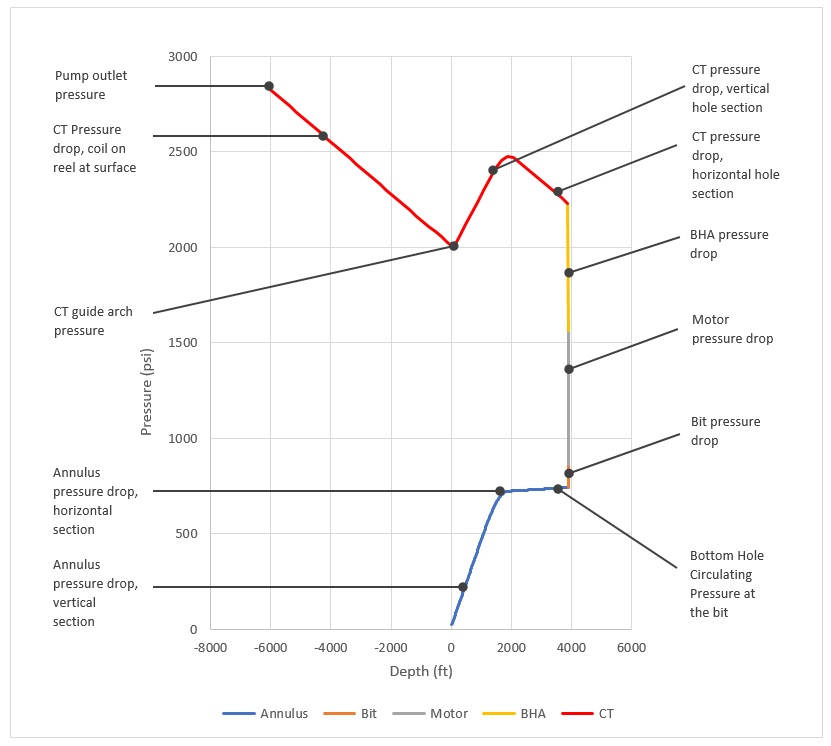
Figure 4 - Typical hydraulic circuit pressures for CT Drilling


+44 1392 933 100 | +1 800-868-1562